 Defillama
Defillama Uses and Data Limits for DeFi Research
Defillama is useful for DeFi research when a question calls for comparable data on protocol capital, trading activity, or income. Its chain and protocol views support screening and trend analysis, provided the metric definitions and reporting windows match. Total value locked (TVL) reflects token prices as well as balances. Fees, revenue, and direct-address counts measure user payments, the protocol's share of fees, and direct engagement, respectively. These measures support comparisons, while conclusions about a particular transaction, contract security, or net profit require different evidence.
In this guide
Bottom line: USD Inflows values changes in asset balances, helping explain TVL movements without treating every price change as a deposit or withdrawal.
When is Defillama useful for protocol comparisons?
Defillama suits protocol comparisons when the question concerns measurable differences between projects with comparable activities and reporting scopes. The Compare Protocols and Compare Chains tools organize comparisons around the chosen projects or networks. A lending comparison can examine locked capital and active loans; exchange research can examine trading volume and fees. Each measure answers a different question, so the intended outcome determines which columns belong in the comparison.
The necessary inputs include the protocols or chains under review, the metric, and a common reporting window. Category and chain information help explain whether entries describe similar operations. The comparison supports a finding about measured activity. It does not, by itself, establish why a project changed or whether its contracts can withstand an exploit. A security assessment needs evidence about the contracts themselves.
Which metric separates balance movements from price changes?
USD Inflows measures net asset balance changes in dollar terms, separating balance movements from changes in token valuation.
USD Inflows multiplies each asset's balance change between consecutive days by its price, then sums the resulting values. TVL answers a different question: the value of eligible assets at the prices used for valuation. A price fall can reduce TVL without a withdrawal, while balance growth can accompany a decline in dollar value. Reading both measures avoids assigning every movement in the capital chart to depositor behavior.
The relevant comparison must cover the same protocol and interval. A net figure can conceal offsetting deposits and withdrawals, so it cannot describe every movement separately. Questions about individual transfers require transaction records with the relevant addresses and amounts. The net total does not identify the cause of each balance movement.
A positive net figure also says nothing about how many separate addresses contributed to it.
Counting boundaries in chain comparisons
Chain comparisons need a consistent counting basis because a protocol listing and a chain total can include different assets. Native staking, liquid staking, bridge balances, and borrowing have specific treatments. A missing contribution to default chain TVL can reflect those rules even when the underlying activity appears elsewhere in the platform.
| Counting parameter | Default treatment | Comparison boundary |
|---|---|---|
| Native token staking | Excluded from TVL | Stake securing a chain does not enter this measure |
| Liquid staking | Tracked; excluded from chain TVL by default | Protocol totals and default chain totals differ in scope |
| Bridge TVL | Tracked for bridge projects; excluded from chain TVL | No contribution to origin or destination chain totals |
| Active loans | Excluded from TVL by default | Borrowed amounts remain separate from default locked capital |
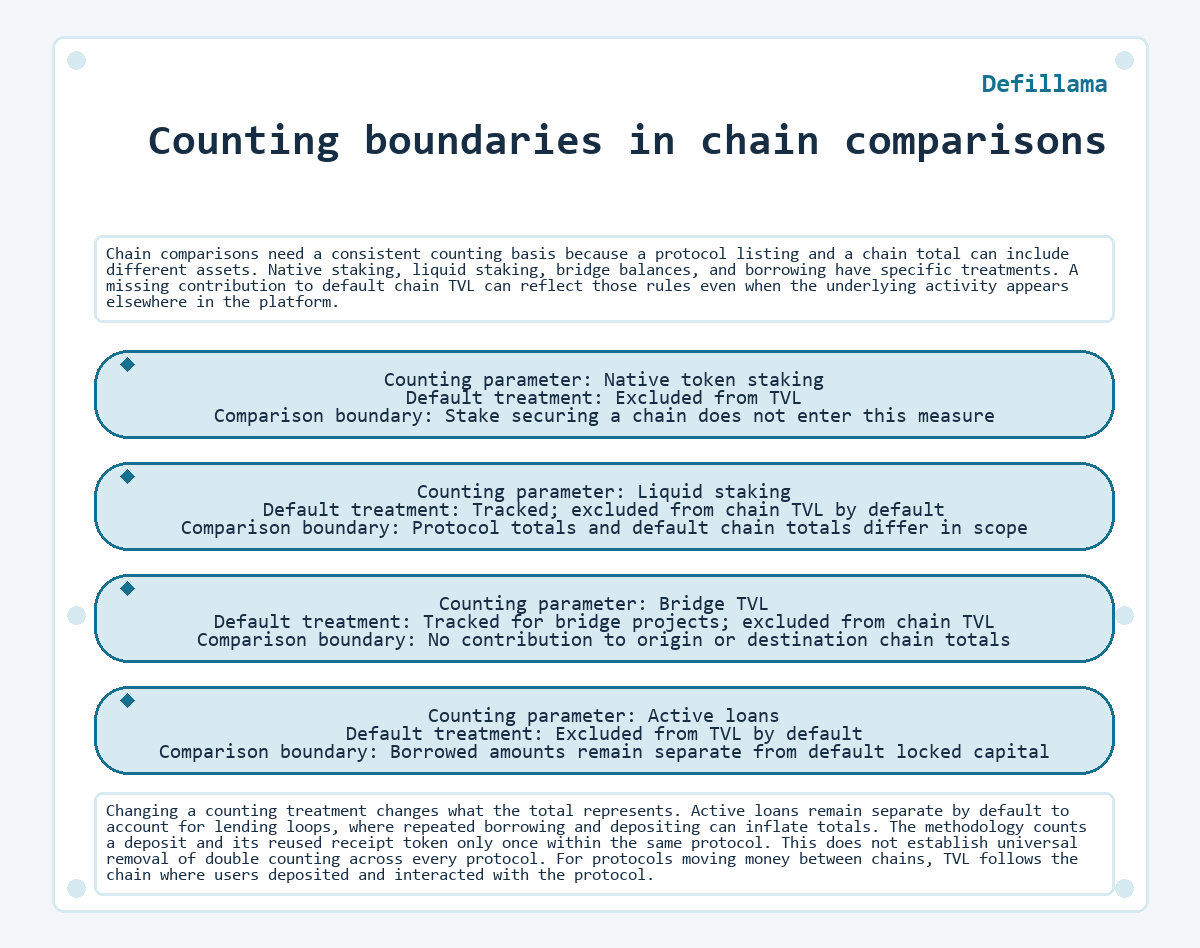
Counting boundaries in chain comparisons
- Counting parameter: Native token staking Default treatment: Excluded from TVL Comparison boundary: Stake securing a chain does not enter this measure
- Counting parameter: Liquid staking Default treatment: Tracked; excluded from chain TVL by default Comparison boundary: Protocol totals and default chain totals differ in scope
- Counting parameter: Bridge TVL Default treatment: Tracked for bridge projects; excluded from chain TVL Comparison boundary: No contribution to origin or destination chain totals
- Counting parameter: Active loans Default treatment: Excluded from TVL by default Comparison boundary: Borrowed amounts remain separate from default locked capital
Changing a counting treatment changes what the total represents. Active loans remain separate by default to account for lending loops, where repeated borrowing and depositing can inflate totals. The methodology counts a deposit and its reused receipt token only once within the same protocol. This does not establish universal removal of double counting across every protocol. For protocols moving money between chains, TVL follows the chain where users deposited and interacted with the protocol.
Trading activity and reporting periods
Trading-volume data fits research into exchange usage and market activity over a defined period. DEX Volume measures the value of trades through a decentralized exchange. Perpetual volume measures trading in perpetual contracts, and aggregator volume describes trades routed through aggregators. Those categories have different meanings even when dashboards express each value in dollars. A protocol's TVL records capital at a point in time; trading volume accumulates activity during an interval.
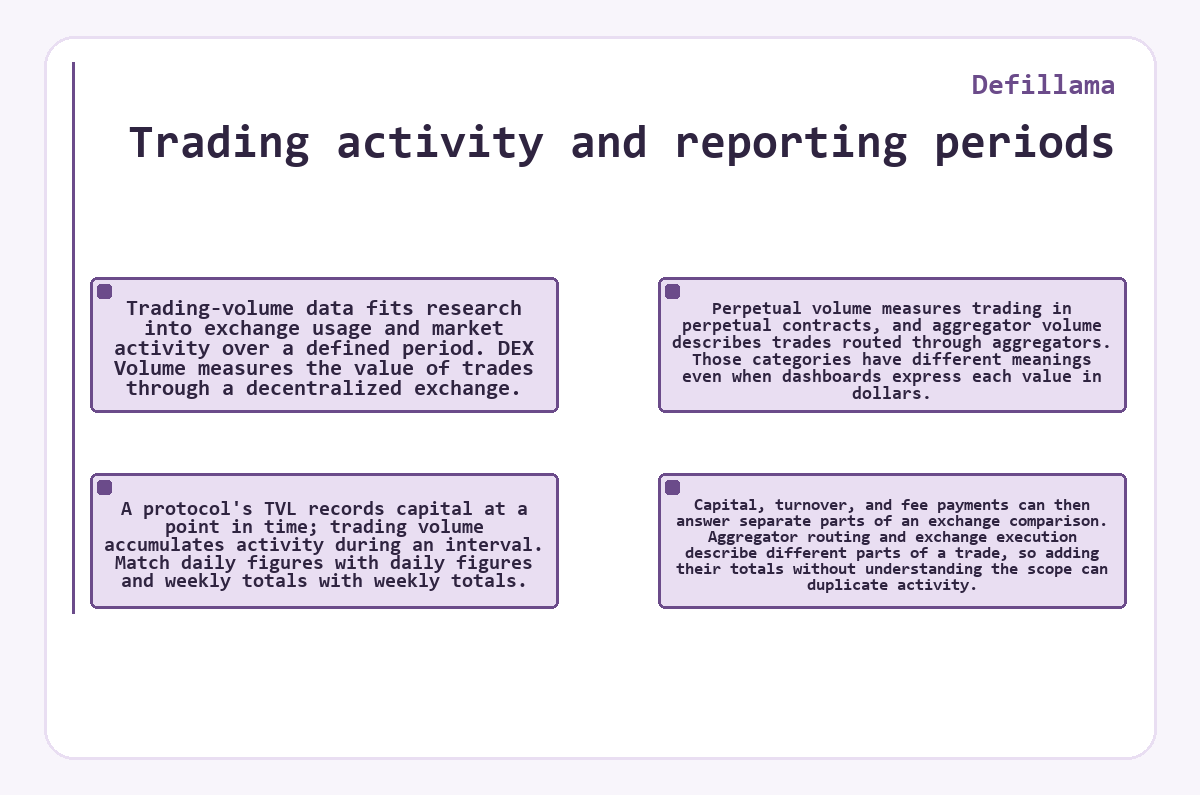
Match daily figures with daily figures and weekly totals with weekly totals. Capital, turnover, and fee payments can then answer separate parts of an exchange comparison. Aggregator routing and exchange execution describe different parts of a trade, so adding their totals without understanding the scope can duplicate activity.
Direct-address counts and liquidation exposure
Active Addresses fits research into direct protocol engagement because it counts unique addresses interacting with the protocol itself. The Active Addresses metric excludes interactions through aggregators or other intermediary contracts. A lower direct-address count therefore cannot establish low overall trading demand when routed activity contributes to volume. Addresses also differ from individual people, so the number does not establish a count of distinct human users.
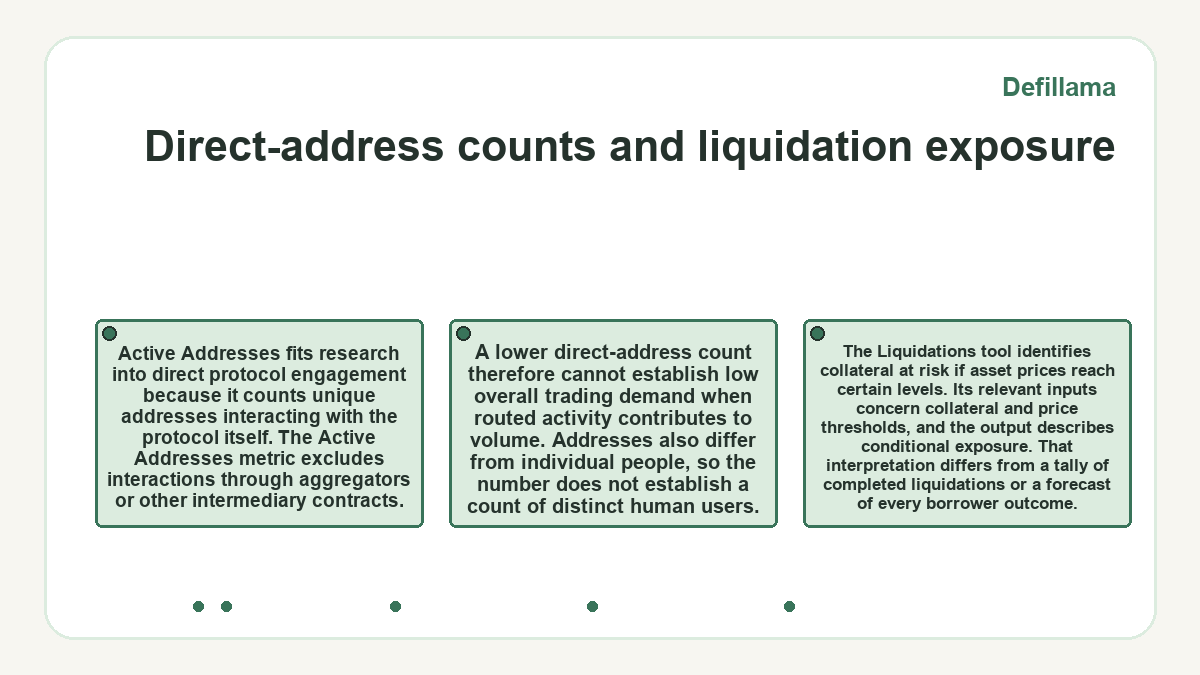
The Liquidations tool identifies collateral at risk if asset prices reach certain levels. Its relevant inputs concern collateral and price thresholds, and the output describes conditional exposure. That interpretation differs from a tally of completed liquidations or a forecast of every borrower outcome.
Can fee data establish protocol profitability?
Fee data alone cannot establish protocol profitability because net profit also depends on expenses over the same period.
Fees measure what users pay to use a protocol. Revenue identifies the share the protocol collects for itself and excludes fees distributed to liquidity providers. The retained share can go to a treasury, team, or token holders. These recipient differences matter when assessing whether high activity translates into resources for a protocol. Holders Revenue narrows the question to revenue reaching token holders through buybacks and burns, fee burning, or direct distributions to stakers.
Expense data draws mainly on annual protocol reports, so its reporting period can lag current fee and revenue displays. Combining those periods into a current profit estimate creates a mismatch. A profitability question requires expenses and retained revenue for a compatible period, with their definitions intact.
Yield and stablecoin data for initial screening
Yield data helps locate pools for a reported annual percentage yield (APY) comparison. A protocol-level median summarizes multiple pools, so it does not quote the return of a selected deposit. The yields watchlist organizes tracked pools. A rate comparison leaves contract security and the conditions of an individual deposit as separate questions.
Stablecoin supply and peg data fit research into liquidity and price stability. Chain stablecoin market capitalization measures stablecoin value across that chain, a broader scope than one protocol's balance. Redemption eligibility needs the terms of the particular stablecoin, since chain-wide supply does not describe an individual redemption right.
Funding, treasury resources, and supply changes
Funding and treasury data answer different questions about a protocol's resources. Total Raised adds funding from venture rounds, public sales, and initial coin offerings. Treasury measures the value of coins the protocol owns and excludes its own created coins by default. Raised capital records financing; it does not establish how much remains available today. Treasury data addresses resources under the protocol's control, subject to the stated asset treatment.
Emissions and unlock schedules support research into when token supply may change. Their useful output is a schedule and its applicable terms, not a guaranteed direction for market prices. A research task about dilution needs supply assumptions beside valuation measures. Market demand and sale decisions remain separate from the existence of an unlock.
Reusable comparisons through dashboards and exports
Dashboard Builder supports recurring comparisons by combining TVL, fees, volume, and other metrics in a custom dashboard without code. A protocol watchlist keeps the selected set visible, while Sheets brings DeFi data into spreadsheets. The Pro plan includes custom dashboards, Sheets, and CSV exports, with CSV downloads disabled during its trial. Chart downloads also offer a way to retain displayed data. These options suit repeated analysis when the underlying measures answer the research question; a custom layout cannot change what a metric counts.
API access suits automated retrieval, and the documentation distinguishes free endpoints from Pro endpoints. Endpoint choice depends on dataset coverage and access requirements. The API plan includes paid endpoint access; the Pro analytics subscription alone does not include it. Record the metric definition, chain scope, date range, and retrieval time alongside an exported series. A retained snapshot makes later revisions distinguishable from the original observation.
Research tools alongside transaction tools
Several tools address narrower questions than a protocol ranking. Token Liquidity examines depth for a given token, and Token Pricing Coverage checks whether a token address on a given chain has a current price. Bridge transaction downloads provide transaction data for a selected bridge and period. These functions become relevant when the investigation concerns market depth, a valuation input, or transfers behind an aggregate cross-chain movement.
LlamaSwap compares trade routes across DEX aggregators, which suits a question about a trade quote or execution route. LlamaPay handles payment uses such as salaries, vesting, one-time payments, and subscriptions. ChainList supplies Ethereum Virtual Machine (EVM) network details for wallet or provider connections. Moving from research to those tasks changes the required inputs and responsibility: a comparison chart does not submit a trade, authorize a payment, or configure a network connection.
The point where aggregate data stops answering
Aggregate metrics stop answering a question when its subject becomes an individual position, transfer, or contract behavior. Transaction records and address balances provide the relevant detail for wallet-specific reconciliation. A protocol total cannot identify every contribution to an individual's outcome. Event annotations can add context to unusual chart movements, including recorded incidents. Their manual curation also means the absence of an annotation does not establish the absence of an event.
Technical security questions require contract-specific evidence, while accounting questions require records for the relevant entity and period. If chain coverage, counting treatment, or reporting windows change, the earlier comparison no longer describes the same scope. A series with changed coverage needs an explicit break or adjustment before it supports a continuous trend claim.
Defillama: quick answers
Does the Token Holder Profit and Loss tool measure a wallet's realized profit?
The Token Holder Profit and Loss tool calculates percentage token-price change between two dates. That measure alone does not establish a wallet's realized profit, which depends on its purchases, sales, quantities, and transaction costs. A wallet-specific profit calculation needs those transaction records.
What does fully diluted valuation contribute to an unlock analysis?
Fully diluted valuation (FDV) shows a hypothetical token market capitalization using expected maximum supply multiplied by price. The calculation assumes all tokens are unlocked and circulating. It provides a supply-based valuation comparison, without establishing individual unlock dates or a future token price.
How does outstanding fully diluted valuation change the supply assumption?
Outstanding fully diluted valuation (oFDV) uses outstanding supply multiplied by price. Outstanding supply equals total supply minus coins not yet allocated. Treasury or reserve coins belong in that subtraction when they remain unallocated. The difference from FDV concerns the supply basis, not a forecast of trading value.
Can governance-token staking stand in for a treasury balance?
Governance-token staking and treasury balances measure different pools of assets. Total Staked values governance coins in the protocol's staking system, while Treasury values coins the protocol owns. The treasury measure excludes the protocol's own created coins by default, so staking participation does not establish funds available for operations.
Where can I report a methodology error affecting a comparison?
The Report Error tool accepts reports about methodology, protocol metrics, and site improvements. For a comparison issue, identify the affected protocol or chain, the metric, and the reporting period. Describe the inconsistent values or counting treatment in the affected field.
Are chain application fees equivalent to gas fees?
App Fees and gas fees measure different activity on a chain. App Fees sums protocol fees while excluding gas fees, stablecoin protocols, and liquid staking apps. App Revenue uses the corresponding revenue scope. These application metrics therefore describe included protocol activity separately from chain transaction fees.
Do token-volume figures count only decentralized trading?
Token Volume measures the value of swaps to or from a token across centralized and decentralized exchanges, so it suits token-wide trading research; DEX Volume follows trades through a particular decentralized exchange and addresses exchange-level activity, requiring a different scope for the comparison.
Is an empty metric field evidence of zero activity?
An empty metric field does not establish zero activity. A displayed zero supplies a reported value, while a blank supplies no value for that observation. Keep the missing field distinct from numerical zero when exporting data or computing a comparison.
· updated